Cookies 🍪

This site uses third party services that need your consent.

Skip to content
Hero background

Stories and stats, connected in one tool.

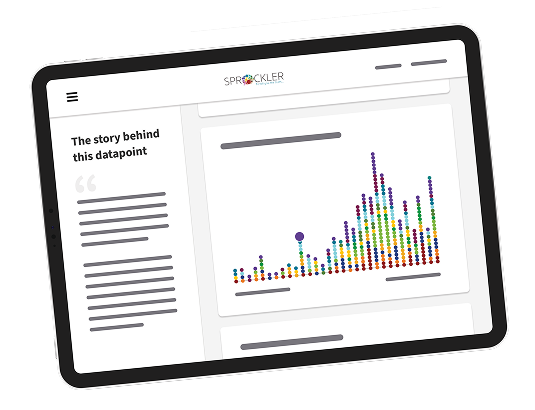
Make your data visual and interactive, with individual stories at the heart of every graph.

App screenshot

The value of qualitative and quantitative combined - plus more.


Quantitative research, like surveys Qualitative research, like interviews Combined research, like Sprockler
Feasible, large-scale inquiry
Rich and contextual data
Less research bias through self-interpretation techniques
Immediate data visualisation showing trends and anomalies

News and upcoming events


News

Capturing Women’s Stories of Change: Sprockler in the POWER Project Evaluation, Timor-Leste

The evaluation of the POWER (Promotion of Women through Economic Empowerment and Rights) Project in Timor-Leste explored how it contributed to women’s economic empowerment,...read more

News

Stories on loneliness in Amsterdam

Amsterdam wants to reduce loneliness in the city. All kinds of organisations and people in area have launched experiments to learn with and from each other about how we can...read more

News

Amsterdam Accessible for All – the first Amsterdam Local Inclusion Agenda

Travelling by public transport, going to school, doing something fun or interviewing for a job. For people with a disability, these ordinary things can be a challenge. According...read more

Used by 100+ organizations to engage with 10.000+ respondents in 25+ countries


TU Delft logo